
License Plate Confidence: Detection, OCR and Whole-Plate Accuracy
Interpret plate detector scores, OCR scores, exact-string accuracy, coverage, calibration and abstention. Use worked examples to distinguish a high-confidence candidate from measured end-to-end performance.
Sources checked · Cyber Search MatchA plate detector score, an OCR score and the chance of a complete correct registration describe different questions. Evaluate localization, transcription and final passage outcomes separately. Report the denominator, retained evidence and rejected cases. A threshold can control which candidates are shown, but only representative labelled evaluation can establish how often those accepted candidates are actually correct.
Ask which event a confidence value describes
The word confidence is incomplete without an event. A detector may score a region as plate-like, an OCR model may score its text hypothesis, and an application may decide whether to display that hypothesis. None of those numbers automatically measures the probability that the complete registration belongs to the intended vehicle and was transcribed correctly.
Use explicit labels in an evaluation record: vehicle detection, plate localization, OCR transcription, format disposition and passage association. Preserve the stage outputs when available. If a final result is wrong, this makes it possible to distinguish a missed character from a crop belonging to the neighbouring vehicle or a normalization rule that removed part of a valid string.
Define the target before choosing a threshold. A manual review queue can retain doubtful alternatives with source crops, while an automated workflow needs a separately evaluated acceptance policy. The same numerical cutoff is not a universal quality standard across models, versions, camera conditions or tasks. Treat it as a configuration decision whose consequences need measurement.
Separate detector confidence from localization metrics
A plate-like bounding box can have a strong detector score while clipping the final character or surrounding the wrong text. Inspect box coverage and association in addition to score. For a registration task, a rectangle that is acceptable under a geometric matching convention may still be a poor OCR input because one small but required region lies outside it.
Ultralytics validation documentation distinguishes precision, recall and mean average precision at stated localization thresholds. These are aggregate evaluation quantities, not the per-box confidence field. A detector's reported mAP does not state how often a downstream recognizer reads the whole registration, and a confidence cutoff changes which predicted boxes participate in the application.
Record missed reference plates as well as spurious boxes. Match predictions to references with a declared rule and handle duplicate predictions consistently. Then inspect the errors relevant to reading: partial crops, wrong parent vehicles, tiny retained plates and competing labels. An attractive average detector metric cannot replace this stage-specific error analysis.
Read the OCR score according to its implementation
The current parser combines recognized text fragments and averages their available scores. That value is not necessarily the minimum character confidence, a length-weighted sequence probability or a measurement of jurisdiction correctness. Fragment grouping itself can be wrong: clear recognition of a state name or slogan is still the wrong output if the intended target is the registration.
PaddleOCR's documented inference parameters include a recognition-score filter that can discard low-scoring output. Application thresholds can then add another filter. Consequently, the absence of a displayed reading can result from several stages. Lowering one visible threshold does not necessarily expose every raw model hypothesis that was rejected earlier in the pipeline.
Keep score interpretation tied to the actual model, decoder and parser version. A change from one OCR system to another can alter the scale and meaning of reported values without changing the interface label. Compare correctness on a fixed review set instead of declaring that a new 0.95 is better than an old 0.90 solely because the number increased.
Distinguish character accuracy from complete-string accuracy
A registration normally needs every required position, in the right order, under a declared comparison policy. A recognizer can be good at most characters while making enough scattered mistakes to reduce complete-string success. Report exact normalized-string correctness separately from edit-distance or character-level measures; they answer different questions and should not share one unqualified accuracy label.
As a deliberately simplified probability exercise, suppose six character decisions are independent and each has correctness probability 0.98. The probability that all six are correct is 0.98 to the sixth power, approximately 88.6%. Real sequence errors can be dependent, and OCR scores are not automatically these probabilities. The calculation illustrates why a character percentage is not a whole-plate guarantee.
For a practical review, record the complete reference and candidate, then identify substitutions, deletions and insertions without hiding exact mismatches. Define how separators, case, stacked registration letters and unsupported scripts are treated. The same comparison policy must apply to references and predictions. Otherwise, normalization can change the evaluation target after the model has already produced its answer.
Toy independence assumption only: P(all 6 correct) = 0.98⁶ ≈ 0.886 = 88.6%. Not an OCR-score conversion.Keep the end-to-end denominator visible
Evaluate the complete task on the population it claims to serve. If the task is reading eligible vehicle passages in an interval, include passages that never produced a plate crop. Reporting OCR correctness only on retained easy crops measures a conditional stage, not the number of correctly read passages out of all eligible passages.
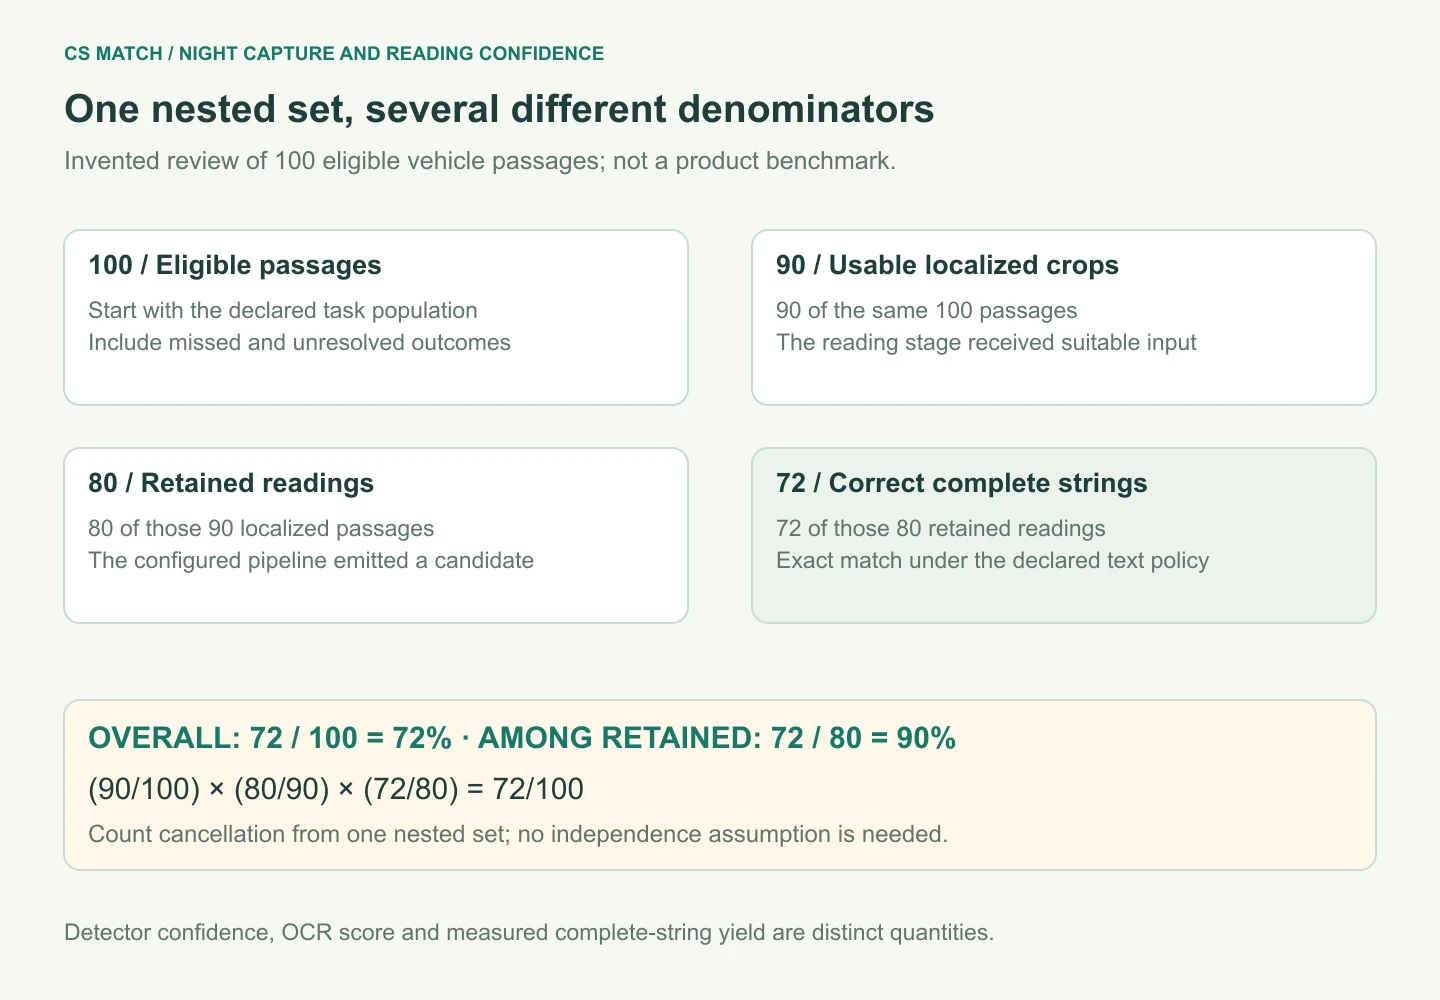
Consider an invented nested review of 100 eligible passages: 90 have a usable localized crop, 80 of those reach the retained-reading stage, and 72 of those have a correct complete string. The final complete-reading yield is 72 out of 100, or 72%. Dividing 72 by 80 gives a different answer, 90%, conditional on retained readings.
Both quantities can be useful when clearly labelled. The first captures end-to-end loss; the second describes accepted output quality under the chosen policy. The nested arithmetic can be written as 90/100 multiplied by 80/90 multiplied by 72/80. This is cancellation of conditional counts from one set, not an assumption that independent benchmark percentages from unrelated experiments can be multiplied.
Same invented nested set: (90/100) × (80/90) × (72/80) = 72/100. Conditional counts, not independent model benchmarks.| Invented stage | Count remaining | Question answered |
|---|---|---|
| Eligible passages | 100 | What population was evaluated? |
| Usable localized crop | 90 | Did the reading stage get suitable input? |
| Retained reading | 80 | Did the configured pipeline emit a candidate? |
| Correct complete string | 72 | Was the whole reference matched? |
Measure the cost of rejecting more readings
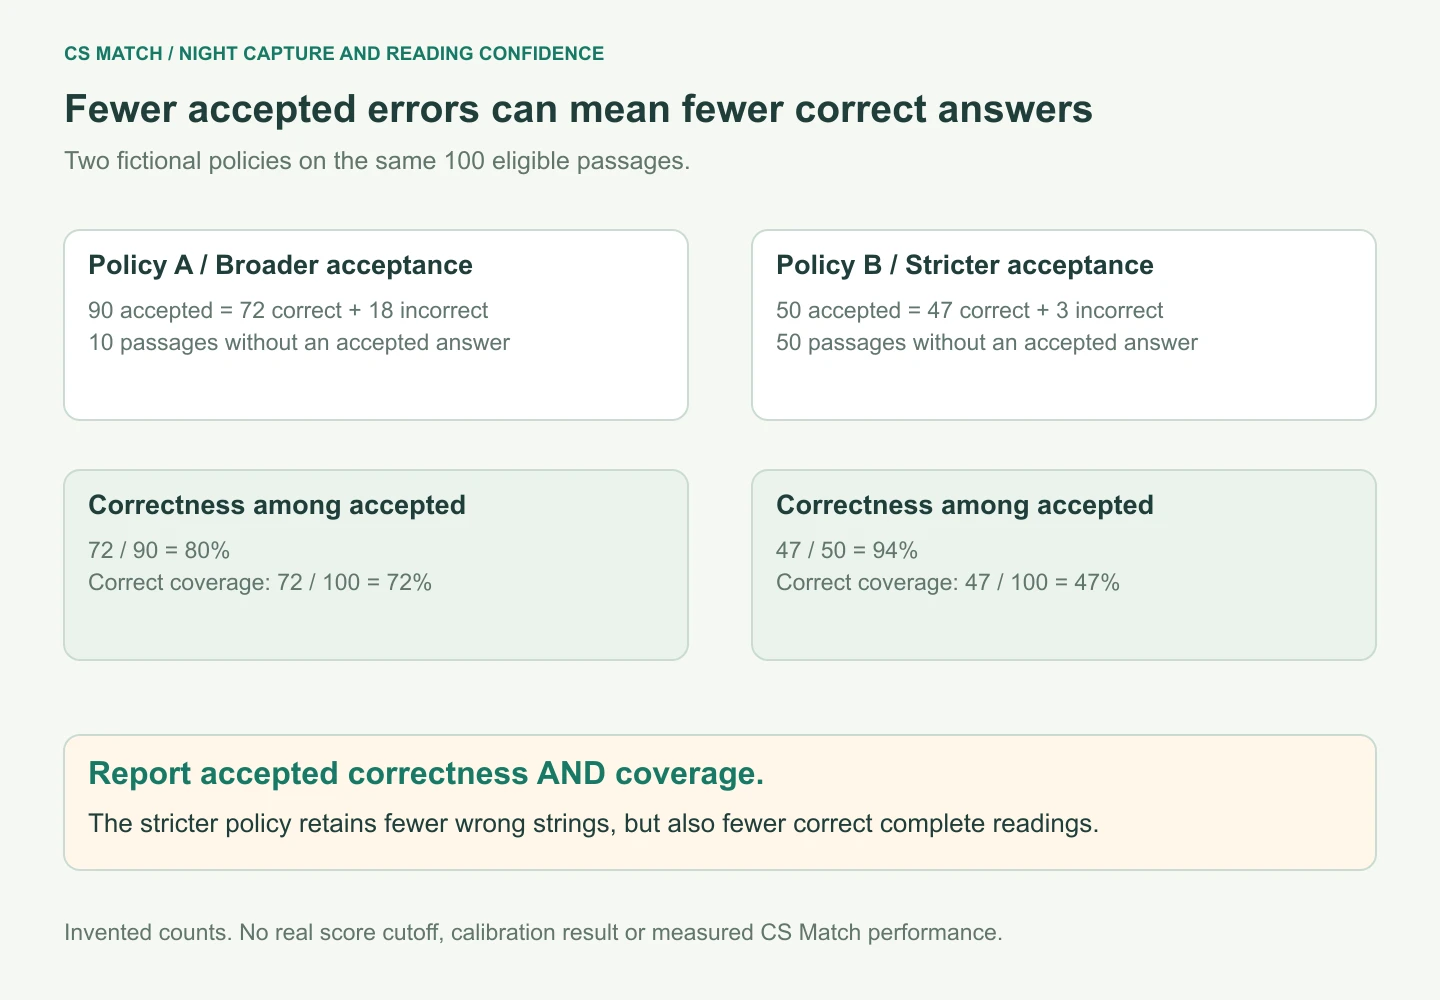
A stricter threshold can improve the correctness of displayed candidates while reducing the number of passages receiving an answer. Selective-classification research studies this relationship between accepted coverage and error among accepted predictions. Its results are not a guarantee for our OCR pipeline; the useful idea is to evaluate both quantities rather than celebrating rejection as accuracy improvement.
In a fictional set of 100 eligible passages, one policy accepts 90 readings and 72 are correct. Accepted-reading correctness is 80%, while correct coverage is 72%. A stricter policy accepts 50 and 47 are correct: accepted-reading correctness rises to 94%, but correct coverage falls to 47%. These are invented counts selected to expose the trade-off.
Compare policies on the same frozen set with a consistent reference definition. Report wrong accepted strings, correct accepted strings, rejected cases and missed opportunities. An unresolved outcome should remain visible in the evaluation even if the interface suppresses it. Otherwise, a system can appear excellent by answering only a few easy cases and silently abandoning the rest.
Calibration is a measured relationship, not a label
Calibration asks whether predicted probabilities correspond to observed frequencies for a specified event. Research by Guo and colleagues demonstrates that strong classification performance does not automatically provide calibrated confidence, and studies postprocessing approaches including temperature scaling. This motivates checking the relationship; it does not establish that a particular method will calibrate a plate pipeline without suitable data.
A proposed reliability check can group complete-reading predictions by a candidate score and compare each group's mean score with its observed exact-string correctness. For example, a group with mean score 0.90 but 70 correct readings out of 100 is not behaving like a calibrated 90% complete-correctness probability on that group. Those illustrative values are not product measurements.
Choose the event, groups and evaluation split before interpreting the result. A calibrator fitted to detector labels cannot automatically certify whole-string correctness. Fitting and evaluating on the same examples can give misleadingly favourable results. Keep an independent assessment and recheck after model, parser or capture changes. Calibration is conditional on the evaluated task and population, not a permanent property of a UI percentage.
Report sample size and uncertainty around observed rates
A measured percentage is an estimate from a particular collection of examples. Ten correct readings out of ten do not establish perfect performance on every future passage. Report the numerator and denominator alongside the rate, and preserve the collection conditions. A rounded percentage without its sample size hides how little evidence may support the claim.
NIST describes confidence intervals for proportions, including Wilson-based methods. Such intervals express sampling uncertainty under stated assumptions; they are not the OCR confidence assigned to a single crop. Do not put these two kinds of confidence in the same field. State the confidence level, interval method and evaluation unit if statistical intervals are reported.
Video observations can be clustered by passage, camera and session. Treating hundreds of neighbouring frames as independent trials can understate uncertainty. Choose an analysis that respects those dependencies, such as passage-level reporting and camera/session-aware resampling where appropriate. A narrow interval calculated from repeated views of one easy car does not establish broad night-time or specialty-plate reliability.
Inspect lighting, layout and distance separately
An overall rate can conceal a condition that matters operationally. Break the review into relevant capture and layout groups: day versus night, near versus far, front versus rear, ordinary versus specialty layouts, and steady illumination versus transitions. Declare the group definitions and include counts, rather than searching retrospectively for a partition that makes the new model look strongest.
Keep the outcome policy consistent across groups. A difficult design should not vanish from the denominator because the format catalogue lacks its template. Mark unsupported context and separate it from incorrect transcription. Likewise, an unreadable source and a readable source rejected by OCR are different diagnoses even when both yield no accepted string.
Prioritize the groups with enough evidence and clear relevance to the intended task. Very small groups need cautious interpretation and more collection. If a configuration improves the overall result by handling common daytime plates while worsening the target night lane, the aggregate cannot decide suitability on its own. Use the breakdown to choose the next practical investigation.
A passing rule or repeated string is additional evidence
A format check answers whether a normalized candidate fits a configured pattern. It does not show that the pixels contain that candidate. Several wrong strings can fit the same rule, and a correct unfamiliar plate can fail a narrow template. Keep rule compliance distinct from image-based transcription confidence and document the jurisdiction/class context behind any correction.
Repeated readings also need a source definition. Two processed variants of one crop share the same captured evidence, and adjacent frames may repeat one blur or glare defect. Agreement can be useful for scheduling or candidate selection without being independent confirmation. A majority of correlated mistakes is still a mistake, even when the aggregate score looks stable.
For an aggregation experiment, evaluate the final passage candidate against an independent reference while retaining its contributing crops. Compare it with a best-frame baseline and include association failures. Do not create a correctness probability by multiplying a detector score, OCR score and voting fraction unless a justified probabilistic model has actually been fitted and validated for that event.
What the current CS Match score fields mean
The resident plate output retains a plate detector value in plateConfidence and the parsed OCR value in ocrConfidence. The top-level confidence of an LPR row is the OCR value. Accepted text is normalized and filtered according to the configured reading settings. These implementation fields should be interpreted by stage, not combined into an invented single probability of complete correctness.
The worker can compare an enhanced crop with its original and stop trying variants when a valid candidate meets its configured high-score condition. The streaming scheduler also uses repeated matching parent observations and a qualifying score to bound further attempts. These are processing heuristics. The current path does not expose a calibrated whole-registration probability or the reliability analysis described in this article.
For review, open the saved crop and parent vehicle, inspect the full string and follow the source time when candidates disagree. If the source supports a reading that the pipeline discarded, investigate the relevant threshold, layout or normalization stage. If the source is unreadable, do not reinterpret a strong model score as independent evidence that the missing character was recovered.
Keep a review record that explains improvements
A useful evaluation record contains the task population, source conditions, reference policy, pipeline version, acceptance settings and stage outcomes. For each eligible passage, retain a correct, incorrect, missed, rejected or reference-unknown disposition under a declared scheme. Include complete-string counts and accepted coverage so that another reviewer can reconstruct the reported result.
Separate threshold selection from the final assessment. Tune on one set, freeze the policy and evaluate on independent footage. Compare the same passages when testing a change, then collect new camera conditions to check generalization. Preserve both gains and regressions. A new component is valuable when it improves the intended outcome under the declared constraints, not merely its own favourite metric.
For CS Match, this means using retained crops, observations and source times to explain candidate readings while measuring proposed changes externally on a labelled review set. The product's existing scores assist inspection; they are not a published accuracy benchmark. Clear denominators and unresolved outcomes make a modest, reproducible improvement more useful than an impressive percentage whose target and exclusions remain unknown.
Questions about this workflow
Does an OCR score of 0.95 mean the whole registration is 95% correct?
Not automatically. The score depends on the recognizer and parser. Complete-string correctness requires a defined target and representative calibration/evaluation; the current worker does not supply that probability.
Why can a stricter threshold improve accuracy but miss more plates?
It rejects more candidates. Report correctness among accepted readings together with accepted coverage and correct complete readings out of all eligible passages. The denominator determines what improved.
Can I multiply detection confidence by OCR confidence?
That arithmetic does not by itself create a valid end-to-end probability. The events, conditioning and dependence need a justified model and validation on the actual task.
Are detector mAP, character accuracy and whole-plate accuracy interchangeable?
No. They evaluate localization, individual transcription errors and complete-string outcomes respectively. Report each with its own matching policy, population and denominator.
Continue with the next useful step
Reading License Plates at Night: Infrared, Glare and Exposure
Diagnose night-time CCTV plate failures through native pixels, exposure, infrared illumination, clipping, focus, shutter behaviour and controlled tests. Separate camera capture improvements from recorded-video processing.
Combining License Plate Readings Across Video Frames
Explore best-frame selection, tracking, majority and weighted voting, edit-distance alignment, character consensus and image fusion, with worked examples and the current CS Match retry mechanism.
How License Plate Recognition Works: From CCTV to Text
Follow the complete ALPR pipeline: video sampling, plate detection, geometry, OCR, format rules, repeated readings and reviewed results, with the current CS Match implementation explained.