
How to Read an Audio Analysis Report
Understand source players, quality indicators, transcripts, speaker groups, voice similarity and signal charts in the current Audio Analysis report.
Updated · Cyber Search MatchStart with the source and quality, then read the transcript and speaker turns, and only then interpret comparison scores. Every view describes part of the same submitted material.
Start with the recording quality.
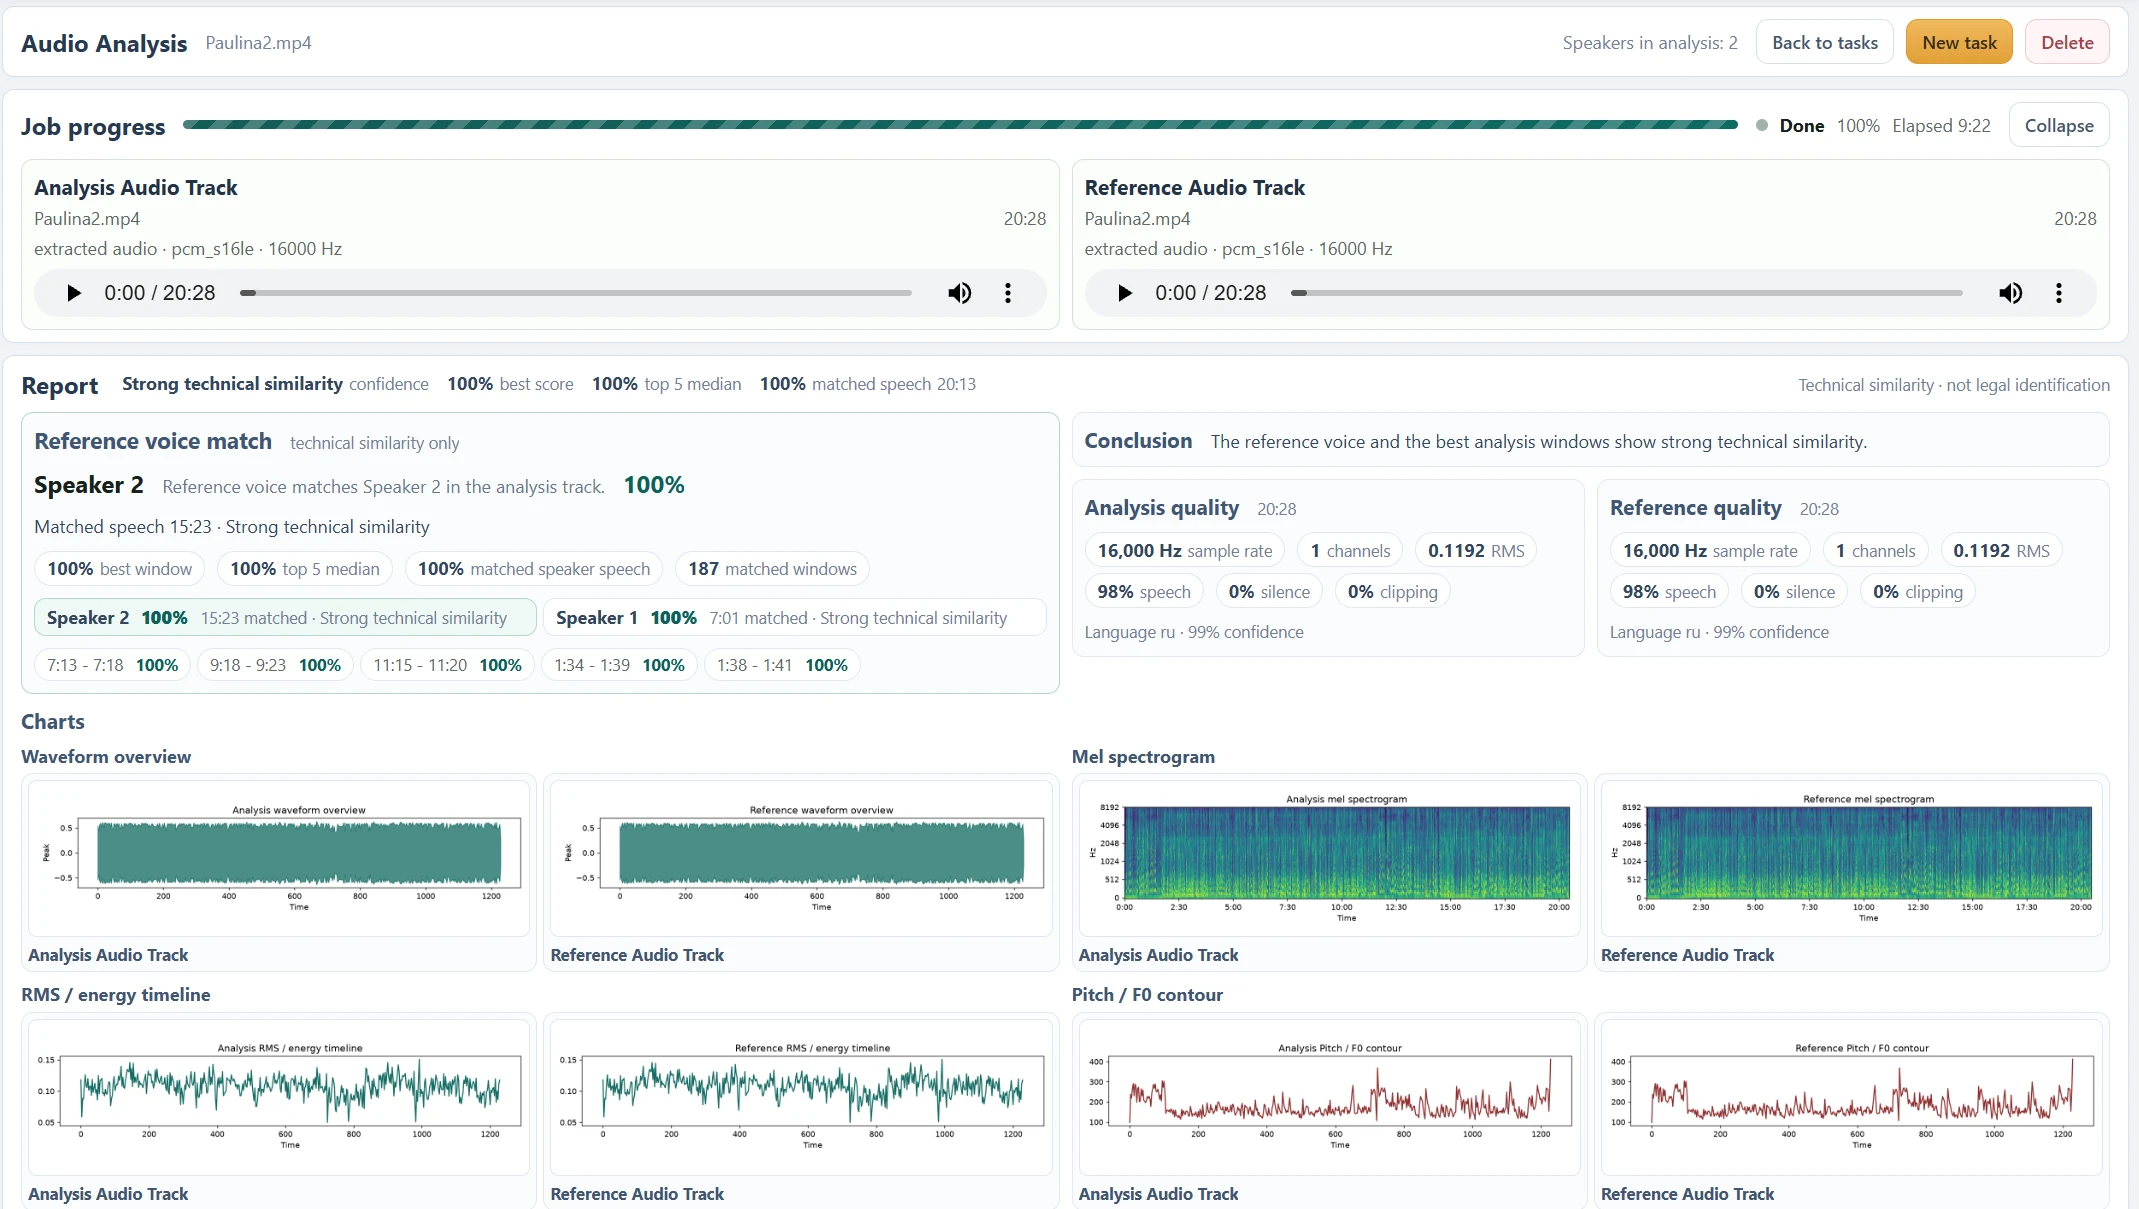
Analysis quality and Reference quality show duration, sample rate, channels, RMS, detected speech, silence and clipping. RMS describes average signal energy; it is not a speech accuracy score. Clipping indicates possible waveform saturation, while a high speech proportion does not guarantee intelligible words.
The examples show extracted mono audio at 16,000 Hz. That is a processing representation of the sound, not proof that the uploaded file was recorded at that rate. Detected language and language confidence describe transcription language estimation, not speaker identity.
Read summaries alongside their windows.
The best score is the strongest matching window. The top 5 median summarizes up to five strongest available windows. Matched speech reports matching coverage, and the speaker summary groups evidence assigned to a speaker label. These quantities have different meanings even when all are displayed near one another.
The Paulina2.mp4 example uses the same file as both sources. Its 100% figures demonstrate the interface, not independently measured real-world accuracy. Check the reference before using a score to support any conclusion.
Use charts to ask better listening questions.
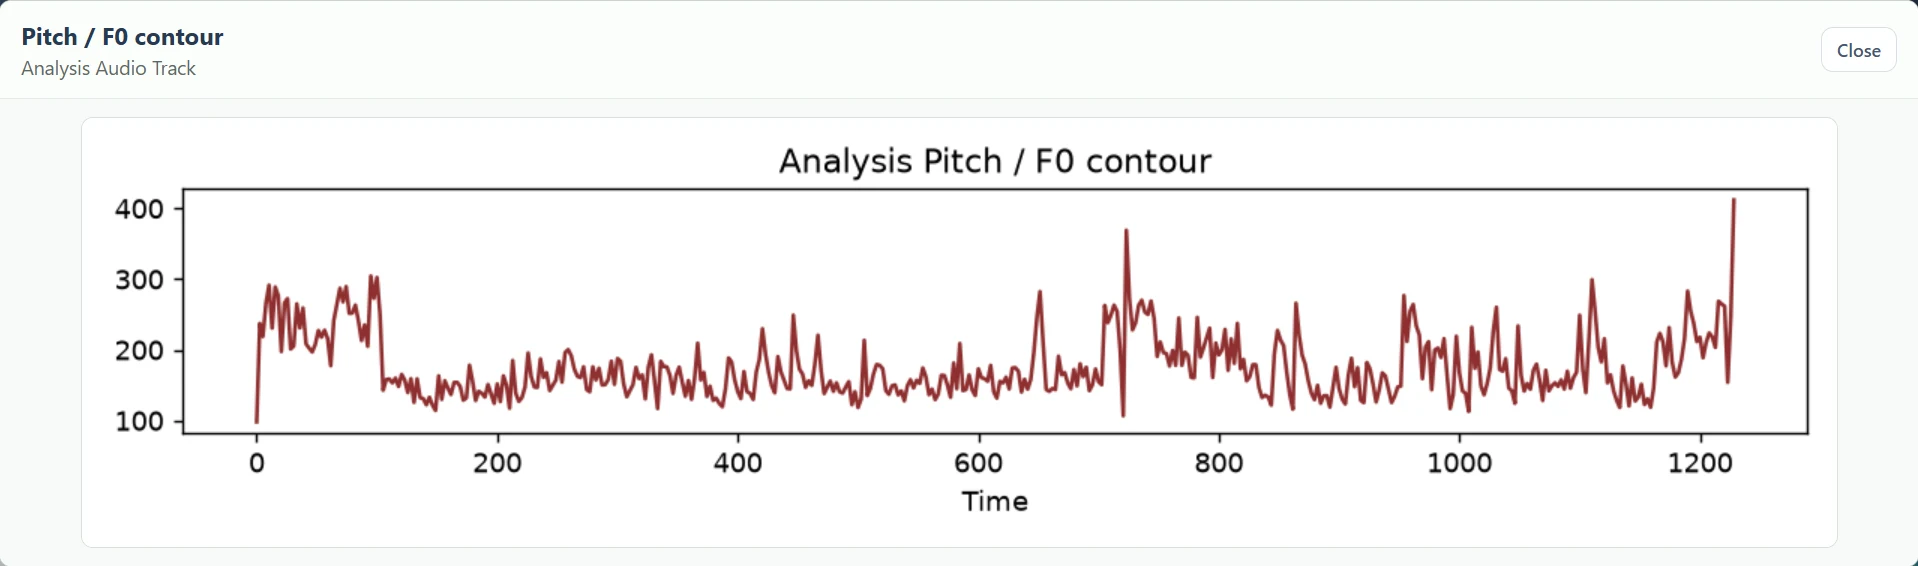
Waveform overview shows how amplitude changes across time. RMS / energy timeline summarizes signal strength. A mel spectrogram displays frequency energy over time. Pitch / F0 estimates the fundamental frequency in voiced sound; unvoiced or noisy sections can be unreliable.
The chart gallery also includes spectral and MFCC summaries where available. These views can reveal changing sound conditions and prompt closer listening. They do not identify a speaker by visual shape. Open a chart for a larger view and compare analysis and reference recordings in context.
Wait for the completed report.
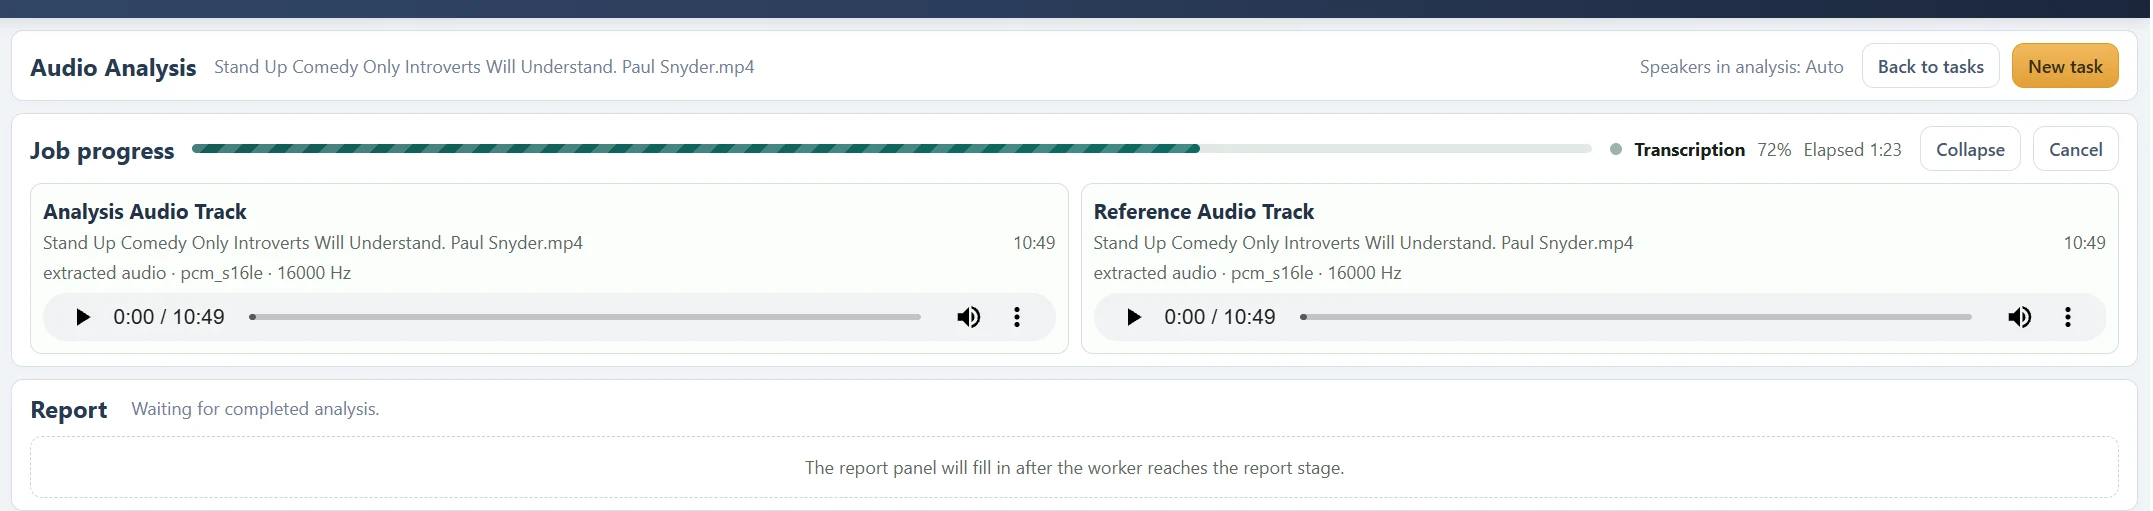
During Transcription, the players can already be available while Report still says it is waiting for completed analysis. Processing percentages are job progress, not transcript accuracy. Return after completion to inspect the final report or read the job error if processing fails.
The current report is for inspection inside the workspace. Transcript editing, standalone subtitle export and translation are not offered controls in this flow. Use the source audio to verify important words and preserve your own reviewed notes.
Questions about this workflow
Do I need a reference file just to transcribe?
Yes, in the current workflow. Select an analysis source and a reference source before starting. There is no separate one-file transcription mode yet. For a meaningful voice comparison, use a clean sample of the voice you want to compare.
Can I close the tab?
Keep the tab open until both uploads and submission finish. Processing then continues in the background; return to your Audio task list for progress and the report.
Continue with the next useful step
Find and Listen to Audio Speaker Segments
Use speaker labels, dialogue turns, matched windows and timestamps to locate and listen to passages in an Audio Analysis report.
What Voice Similarity Scores Mean
Understand best score, top 5 median, matched speech, speaker summaries and technical similarity labels without treating them as identity probabilities.
Audio Transcription Language Support
Check the current English, Ukrainian and Russian configuration, automatic language detection and limitations for multilingual or unclear speech.